Recovering features of the observed solar wind spectra by means of high-resolution hybrid simulations

High-resolution two-dimensional hybrid simulations of turbulence with an out-of-plane ambient magnetic field are able to simultaneously reproduce several aspects of observed solar wind spectra over a large range of scales, from the MHD to the sub-ion kinetic range.
In situ measurements of the solar wind plasma and electromagnetic field show spectra with a power-law scaling spanning several decades in frequency. Power laws support an interpretation in terms of turbulent fluctuations, although the rich variety of spectral features is not easily explained in the framework of known turbulent theories and phenomenologies.
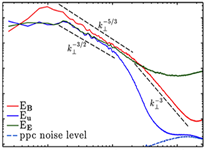
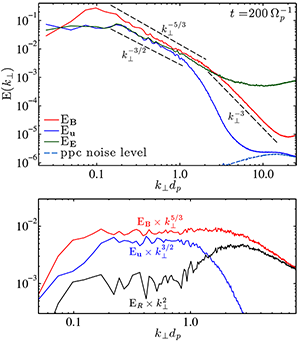
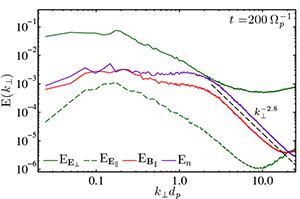
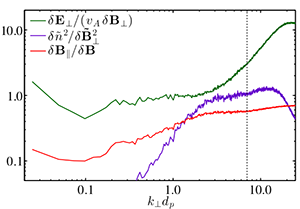
By performing a high-resolution 2D numerical simulation with the CAMELIA code, we were able to provide the first direct numerical evidence of the simultaneous occurrence of several features observed in the solar wind spectra. These include (i) a power-law scaling of the spectra of the magnetic and kinetic fluctuations and of the residual energy in the MHD range, with different spectral indices (-5/3, -3/2 and -2, respectively) [Fig. 1], (ii) a magnetic spectrum with a clear double power-law scaling separated by a smooth break at ion scales [Fig. 1], (iii) a strong coupling between density and magnetic fluctuations at small scales [Fig. 2], (iv) a flattening of the electric field spectrum at sub-proton scales [Fig. 2], and (v) an increase in magnetic compressibility at small scales [Fig. 3].
Our results indicate that the switch in the spectral slopes observed in the solar wind results from the natural continuation of a large-scale MHD turbulent cascade through proton and down to electron scales, where the different field couplings are governed by the non-ideal terms of Ohm’s law.
The other features shown in Fig. 3 suggest that turbulence at sub-proton scales is ruled by fluctuations with properties of kinetic Alfvén waves.
The data obtained by performing this 2D hybrid simulation are available online on the Virtual Mission Laboratory Portal (see reference below).
 Figure 1.
 Top panel: omnidirectional spectra of total magnetic (red), total kinetic (blue), and total electric field (green) fluctuations vs. perpendicular wavenumber
k⊥ at the time of the maximum turbulent activity. The spectrum of kinetic energy at
t = 0 is plotted with a dashed light blue line as an indicator of ppc noise level. Dashed black lines are references for the corresponding spectral indices. Bottom panel: magnetic (red), kinetic (blue), and residual energy (black) spectra compensated by
k⊥5/3,
k⊥3/2, and
k⊥2, respectively.

Figure 2. Omnidirectional spectra of density (purple line), parallel magnetic field (red line), parallel and perpendicular electric field (green dashed and solid lines, respectively) vs. perpendicular wavenumber
k⊥ at the time of the maximum turbulent activity.
 Figure 3.
 Ratio of perpendicular electric field to perpendicular magnetic field (green), ratio between normalized density and perpendicular magnetic fluctuations (purple), and ratio of parallel to total magnetic field fluctuations (magnetic compressibility; red).
References
Franci L., Verdini A., Matteini L., Landi S., and Hellinger P., ApJL 804 L39 (2015)
“Solar wind turbulence from MHD to sub-ion scales: High-resolution hybrid simulations”
Link:
adsabs.harvard.edu/abs/2015ApJ...804L..39F
CAMELIA code’s website:
terezka.asu.cas.cz/helinger/camelia.html
Numerical data of the mentioned simulation on the Virtual Mission Laboratory Portal:
amalka.asu.cas.cz/esa/index.php/projects/10075